Call me a biased man, but I'm a person who needs visualization for better understanding what is going on under the hood in different situations. And scraping data is one of those.
How many times during a scraping project have you asked yourself:” Well, so what I’m scraping, at this point? Have I lost something? Did I retrieve all the needed data?”. These are just some of the cases where you may need to visualize the data you scraped.
One way to visualize the data you scraped is, for example, in a Jupyter Notebook using libraries like Pandas and Matplotlib. However, what happens if a stakeholder asks you something like:” Just send me a dashboard for a POC. I want to have a rough idea of the data so that you can continue your scraping job”. Well, in this case, you can not just send them a Jupyter Notebook with code and plots. Also, you can not just throw at them a dozen plots with no explanations and no connections between them. Finally, you absolutely can not set a database up and deploy your visuals on the web.
Well…you could do something similar to a web deployment, but in a way that is 100 times easier and faster. In this article, I will show you how to do so using Streamlit.
Ready? Let’s get into it!
Before proceeding, let me thank Decodo, the platinum partner of the month, and their Scraping API.
Scraping made simple - try Decodo’s All-In-One Scraping API free for 7 days.
Streamlit is an open-source Python library that provides a simple and fast way to build and share custom web applications for data visualization. At its core, it allows you to transform a standard Python data script into a beautiful, interactive web app with just a few lines of code.
Streamlit's primary advantage lies in its rapid development cycle. What would typically require a complex web framework like Flask or Django can be accomplished in a fraction of the time. To do so, Streamlit treats Python variables as user-facing widgets. This enables developers to effortlessly add sliders, buttons, and dropdowns, making it easy for non-technical stakeholders to interact with data, visualize results, and understand the impact of different parameters in real-time. This makes it the ideal choice for creating interactive dashboards, data exploration tools, and prototypes that can be shared with stakeholders who are interested in understanding more about the data you are scraping.
So, in the context of analyzing scraped data, you should use Streamlit when you need to move beyond static Jupyter notebooks to create dynamic and shareable dashboards from your data analysis.
Below is a list of Streamlit’s main features:
Turn scripts into apps instantly: Streamlit’s core philosophy is to treat a Python script as a web app. There is no hidden state, no need to define routes, and no HTML, CSS, or JavaScript knowledge required. You write your code in a .py file, and Streamlit renders it from top to bottom. This means you can take an existing data analysis script, add a few Streamlit function calls, and have a working web application in minutes.
Interactive widgets with Python calls: You can make your apps fully interactive with a rich set of widgets that Streamlit creates with simple function calls. When a user interacts with a widget, Streamlit automatically reruns your script with the new input. This provides users with a reactive and intuitive user experience without any complex callback handling.
Seamless data and visualization integration: Streamlit excels at displaying data. It has native commands for rendering Pandas DataFrames and seamlessly supports all major Python visualization libraries, including Matplotlib, Plotly, Altair, and Vega-Lite.
Caching for high performance: To prevent performance bottlenecks from heavy computations, Streamlit includes a caching mechanism. By adding a single decorator (@st.cache_data or @st.cache_resource) to a function, you tell Streamlit to execute it only once for a given set of inputs. On subsequent runs, Streamlit skips the execution and reuses the stored output. This ensures your applications remain fast and responsive even when dealing with computationally intensive tasks.
This episode is brought to you by our Gold Partners. Be sure to have a look at the Club Deals page to discover their generous offers available for the TWSC readers.
How To Build a Scraper Dashboard With Streamlit in Python: Step-by-step Tutorial
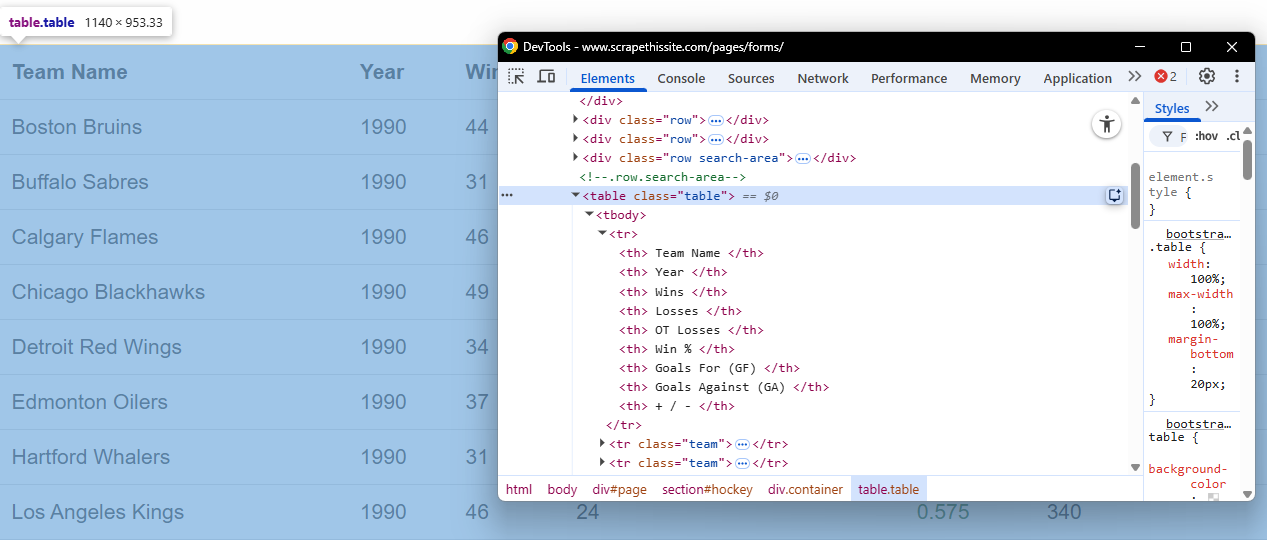
This tutorial section describes how to create a dashboard in Streamlit that scrapes the data from a website and plots interactive graphs. The target page is the “Hockey Teams: Forms, Searching and Pagination”. The scraper will retrieve the data from the following table:
The target table of this tutorial
When you launch the Streamlit server on your local (or deployed) machine, the application will do the following:
A new, interactive board will automatically run in your browser.
You can set the number of pages to scrape, among all the available on the target page. You can also set a delay between scraping requests, if you want.
You will launch the scraping process by clicking on a button in the Streamlit UI.
When the scraping process is completed, you will see the results and interact with the dashboard in different ways.
Alright, let’s get into it!
Before continuing with the article, I wanted to let you know that I've started my community in Circle. It’s a place where we can share our experiences and knowledge, and it’s included in your subscription. Enter the TWSC community at this link.
The goal of the scrape.py file is to scrape the data from the target page. To do so, you have to intercept the table and the tabular data. For example, via the CSS selectors:
The target table in the Chrome DevTools
To do so, you can write the following function:
def _detect_target_table(soup: BeautifulSoup):
    """
    Find the target table on the page.
    """
    for tbl in soup.select("table"):
        # Try thead headers first; fall back to first row headers
        ths = [th.get_text(" ", strip=True).lower() for th in tbl.select("thead th")] or \
              [th.get_text(" ", strip=True).lower() for th in (tbl.find("tr") or []).select("th")]
        if any("team" in h for h in ths) and any("year" in h for h in ths):
            return tbl
    return None
All the other functions in the scrape.py file clean the data and prepare the transformation into a Pandas dataframe.
Good. Let’s move towards creating plots out of the data.
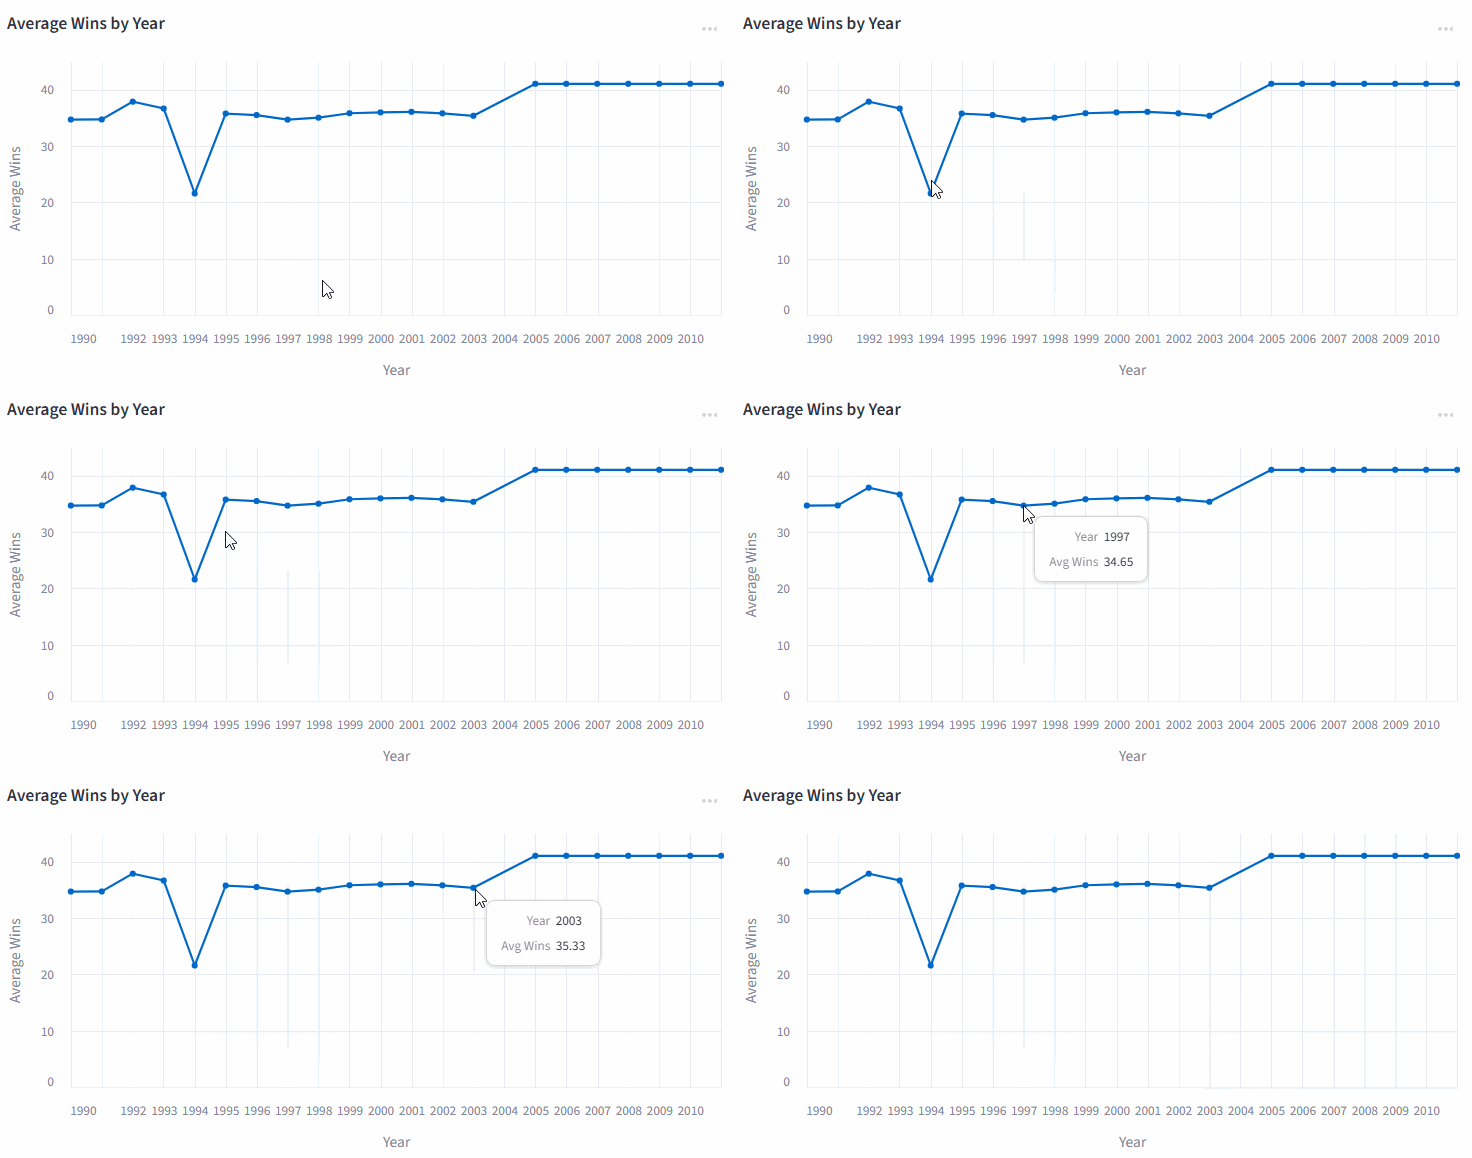
The charts.py file uses the library altair for creating interactive plots from the Pandas dataframe created from the scraped data. For example, say you want an interactive plot that shows the mean wins for each season. You could use the following code:
def avg_wins_per_year(df: pd.DataFrame):
    """Return a line chart showing average wins by season."""
    d = df.copy()
    if "wins" not in d.columns or "year" not in d.columns:
        return alt.LayerChart()

    d["year"] = pd.to_numeric(d["year"], errors="coerce")
    d = d.dropna(subset=["year"])
    agg = d.groupby("year", as_index=False)["wins"].mean()

    chart = (
        alt.Chart(agg)
        .mark_line(point=True)
        .encode(
            x=alt.X(
                "year:Q",
                title="Year"”,
                scale=alt.Scale(domain=[1990, 2011], nice=False),
                # Integer formatting
                axis=alt.Axis(format="d", formatType="number", tickMinStep=1, labelOverlap="greedy"),
            ),
            y=alt.Y("wins:Q", title="Average Wins"),
            tooltip=[
                alt.Tooltip("year:Q", format="d", title="Year"),
                alt.Tooltip("wins:Q", format=".2f", title="Avg Wins”"),
            ],
        )
        .properties(title="Average Wins by Year")
    )
    return chart
The Web Scraping Club is a reader-supported publication. To receive new posts and support my work, consider becoming a free or paid subscriber.
The result you will visualize later in the dashboard is the following:
An interactive plot made in Altair
Very well. After creating the plots, let’s move on to the main application.
Step #3: Develop The Main Streamlit Application
The app.py file is where you store the code that actually runs the Streamlit application. In this Python file, you have to take care of calling the functions of the plots and managing the dashboard. For example, consider the following function:
 with st.sidebar:
        st.header(”Controls”)

        pages_to_scrape = st.slider(
            “Pages to scrape”,
            min_value=1,
            max_value=25,
            value=6,
            help=”Follows the next (») link until this many pages are scraped.”
        )

        delay_sec = st.slider(
            “Delay between requests (s)”,
            min_value=0.00,
            max_value=0.50,
            value=0.10,
            step=0.05,
            help=”Be polite to the site. 0.10–0.20s is reasonable.”
        )

        start = st.button(”Start scraping”, type=”primary”)
This code allows the Streamlit application to manage the sidebar controls. In the UI, you will find:
A control to decide the number of pages to scrape.
A control to define the eventual delay between the scraping requests.
A start button. When you click it, it will scrape the target page and render the plots.
Very well! You created the Python code that manages the Streamlit application. Now, let’s see the results in action.
Step #4: Run The Application and See The Results
From the command line, launch the application by typing:
streamlit run app.py
The UI is rendered in http://localhost:8501/ and renders as follows:
The rendered UI by Streamlit
On the left side, you can see the controls, as introduced in the previous step. Let’s see the results when clicking on Start scraping:
Starting the sctaping process and navigating the UI
Note that you can also use the filters in the Raw data section and download a CSV of the filtered data:
Filtering data in the Streamlit dashboard
As you can see, the dashboard automatically updates live as you change the filters.
Terrific! You created your first dashboard with Streamlit using scraped data.
Conclusion
In this article, you have learned how easy it is to create a dynamic dashboard in Stremlit from scraped data. By clicking on Deploy, you can choose among different deployment options:
Deploy a Streamlit project
This allows you to share your dynamic dashboards with stakeholders who can use them and derive visual insights from the data you scraped. This is a good solution for providing an intermediate result to a stakeholder before going too deep on a scraping project when maybe there is no need to do so—and I know you have already been there!